Weather Bee: Dry second week of August erased monsoon gains from the first week
India monsoon: Dry second week of August erased gains from the first week, pushing the cumulative rainfall deficit back to 10.5%, IMD data shows. | India News
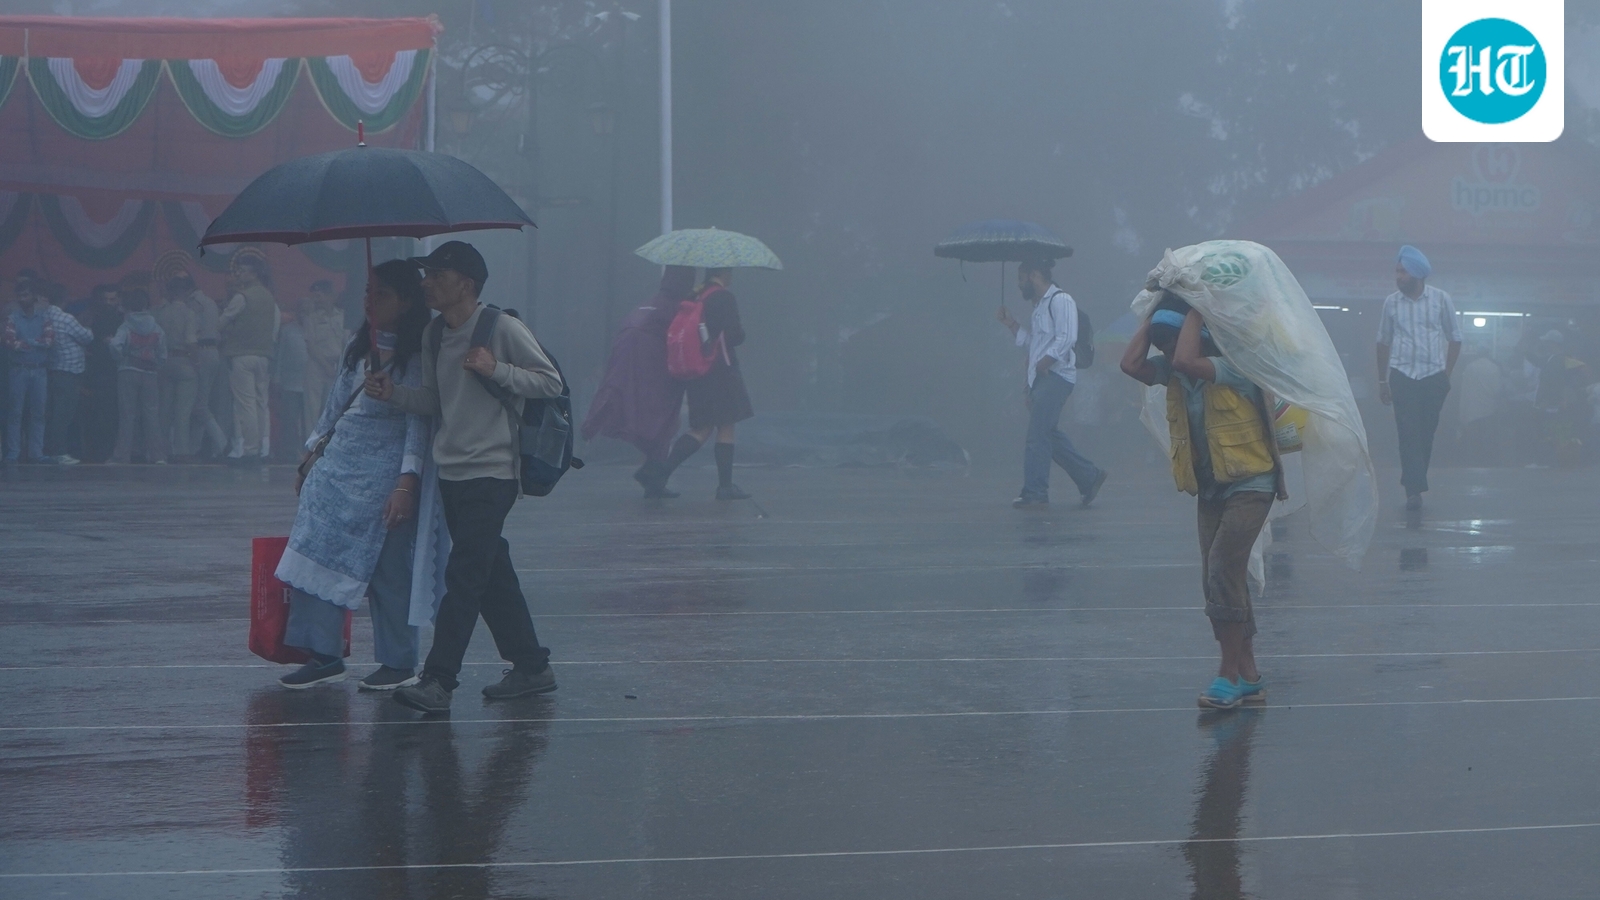
India monsoon: Dry second week of August erased gains from the first week, pushing the cumulative rainfall deficit back to 10.5%, IMD data shows.
The correlation between El Niño and India’s monsoon rainfall is best assessed at the seasonal scale, meaning a week or two of heavy or deficient rain does not necessarily reflect its impact. August so far is a case in point: after a rainy first week, a dry second week pushed the monsoon’s cumulative deficit back to the July 31 level, even as the area under deficient rainfall remains marginally lower.
The biggest impact of the rain in the first week of August was seen in a decline in the cumulative deficit. India’s cumulative deficit compared to the 1971-2020 average, which the India Meteorological Department (IMD) considers as the Long Period Average (LPA) for tracking rain’s performance, reached 9%, the lowest it has been since June 5. This happened despite the August surplus at the time being a modest 1.6%. This is because August is one of the two rainiest months of the monsoon in the LPA, which leads to even small surpluses in the month mattering more for the cumulative deficit.
The second week has had the opposite effect. With big deficits, August rain has developed a 10.5% deficit. This has also returned the monsoon’s cumulative deficit to 10.5%, the same level it was on July 31.
To be sure, the cumulative deficit going back to July 31 does not mean that the area under “deficient” or “large deficient” categories has increased in any meaningful way. These categories are reserved for a local deficit of 20%-59% and 60% or more, respectively.
Surpluses of similar degrees are called “excess” or “larger excess”, while rain within 20% of the LPA is called normal. The area under the deficient categories was 46.2% on July 31. This decreased to 45.3% on August 7 and has increased only marginally to 45.4% by August 14.
In fact, compared to August 7, the area under the excess categories has also increased from 16.6% to 16.7%.
To be sure, the geographical pattern of the area under deficient categories has changed significantly compared to July 31. For example, states like Kerala, Tamil Nadu, Jharkhand, Assam, and Haryana have seen deficient area decrease by almost 10% of their total area. Uttar Pradesh and Karnataka have also seen such area decrease by over 5%. On the other hand, deficient area has increased by over 5% of the state’s total area in Telangana, Himachal Pradesh, Jammu and Kashmir, Chhattisgarh, and Maharashtra since July 31.
These trends highlight that assessing the overall monsoon situation after a couple of weeks of good or bad rain is not wise. This is especially true of the geographical distribution of rain. For example, as HT has reported earlier, even the correlation between El Niño and rainfall is not uniform for all regions of the country. It has become weaker over time for central India while remaining relatively stable for northern and southern India. The final impact of El Niño will only be seen in the final print of the monsoon on September 30, with the current status not very far from the forecast for the season by the IMD.
Abhishek Jha is Assistant Editor-Data at Hindustan Times. He uses statistical programming to generate newsworthy insights from large datasets. He is part of the team that produces Number Theory, a daily data story feature of the paper’s print edition. Since March 2024, he has been writing Weather Bee, a weekly column for the Hindustan Times website. He is a chemical engineer by training, who specialises in stories related to weather, climate, and the environment. Jha has been at HT since 2018, where he offers data-driven perspective and analysis on politics, environment, weather, climate, economy and society. His work includes data coverage of elections in India and abroad, including the 2019 and 2024 Lok Sabha elections; the disasters and extreme weather resulting from changing climate, such as floods, droughts, heat waves, cold waves, and dwindling snow cap in the Himalayas; the factors that drive poor air quality in northern India; the changing patterns of land use; the Covid-19 pandemic and its impact on labour market conditions; the changing pattern of consumer spending seen in the new consumer spending surveys; and social norms seen in the surveys such as the National Family Health Survey.Read More